RRD and another RTU 20/1/2009
Well, this must be the week for rapid progress. A second modbus RTU onto my RS485 bus and some historical trending using rrdtool.
That's just about it for building blocks, so now I can focus on refining the higher level software on the RTU for input conditioning, event counting and some other useful real-world bits. On the PC side I need to write a bunch of glue to hold all the bits together, focusing very clearly on ensuring it dosn't become a great mess of complex spaghetti!
Creating a unified configuration and admin tool for this is probably the biggest challenge. Even some of the better commercial SCADA/HMI systems have idiosyncratic interfaces and defy logic when you approach them from a user-interface point of view. The pain is outweighed by the delivery of a decent looking HMI of course, but I want to eat the cake as well.
To get both RTU's working the PIC end now now supports soft update of the modbus address, and has a jumper to force the address to 199 so it can be accessed. The modbus address is written into the eeprom on the PIC to make it persistent.

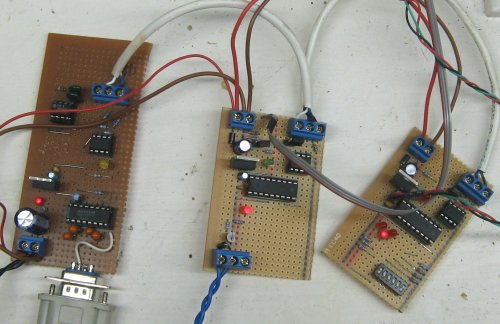
The RS232 - RS485 link on the left, with the two test RTU's. The one on the right is the original, the middle one is the new one with a simple single NPN output, which is driving a relay through the blue wires which turns on the lights for a bit of testing.
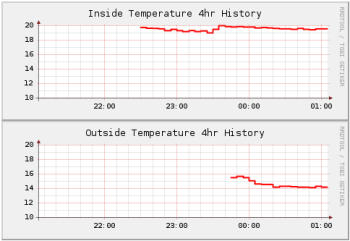
Each of the RTU's has a DS18B20 temperature sensor connected so I could have some 'analog' input data to work with in testing, which came in handy for my rrdtool experiement as below.
Next step for the RTU's hardware wise is a thermalcouple interface, as I have a project comming up which requires temperature sensing in the 300-400 degree range, which obviously the wee Dallas one-wire sensors are not capable of doing.
 The second little leap in functionality is the use of rrdtool to create some purdy graphs of the data coming in from the RTU's.
This is made somewhat trivial by the shared memory interface I've just got working between pollershm and the php/AJAX code. Although the output is quite cool, it only took about 10 minutes reading on the rrdtool tutorial and a little bit of fiddling with a shell script to get this output going.
I'll be able to link these graphs off the AJAX code on a mouse-over or link to give immediate access to data trends and history behind points in the HMI.
I've got a bit to learn about rrdtool and getting multiple values on one graph, but it will certainly be a lot quicker than writing a tool from scratch.